Production reporting and OEE
OEE (Overall Equipment Effectiveness) indicators are today one of the key standards for monitoring production efficiency in most modern manufacturing companies. Our monitoring system provides advanced tools for working with OEE. Users can easily track current and historical values, compare equipment performance and identify weak points in the production process. The visualisation is adapted to different user levels in the organisation — from clear panels for operators on production lines to detailed analytical views for production managers, process engineers and management. The system also allows you to set targets and track trends over time, which strongly supports Continuous Improvement.
A number is not the goal! Increasing OEE must not be an end in itself. The point is to uncover losses, not to "make a nice number in a spreadsheet". Sometimes a lower OEE is a sign of honest measurement.
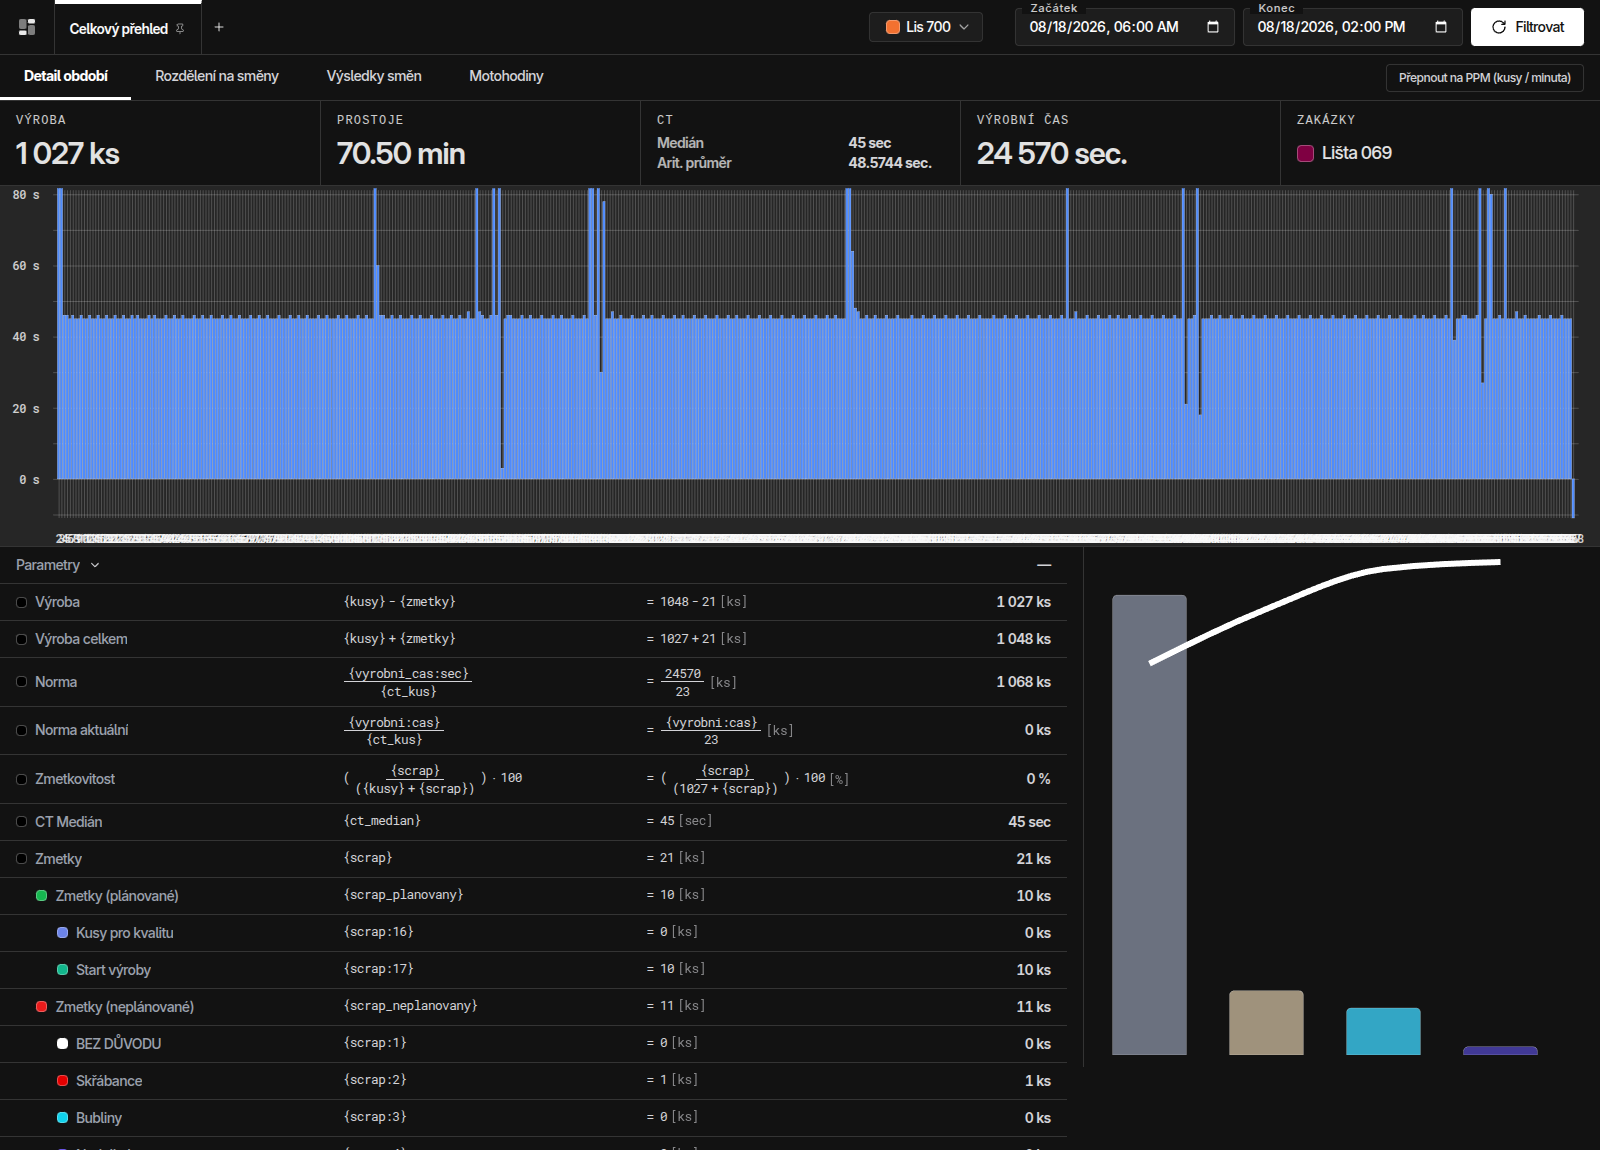
Shift detail
Provides a complete timeline of the shift with an overview of all events at minute resolution. It lets you track exactly what happened during the shift, from production through state changes to downtimes. It also includes a Pareto analysis of downtimes, which clearly shows the most frequent causes of unproductive time and their share of the total loss, making it easier to identify the main areas for improving production efficiency.
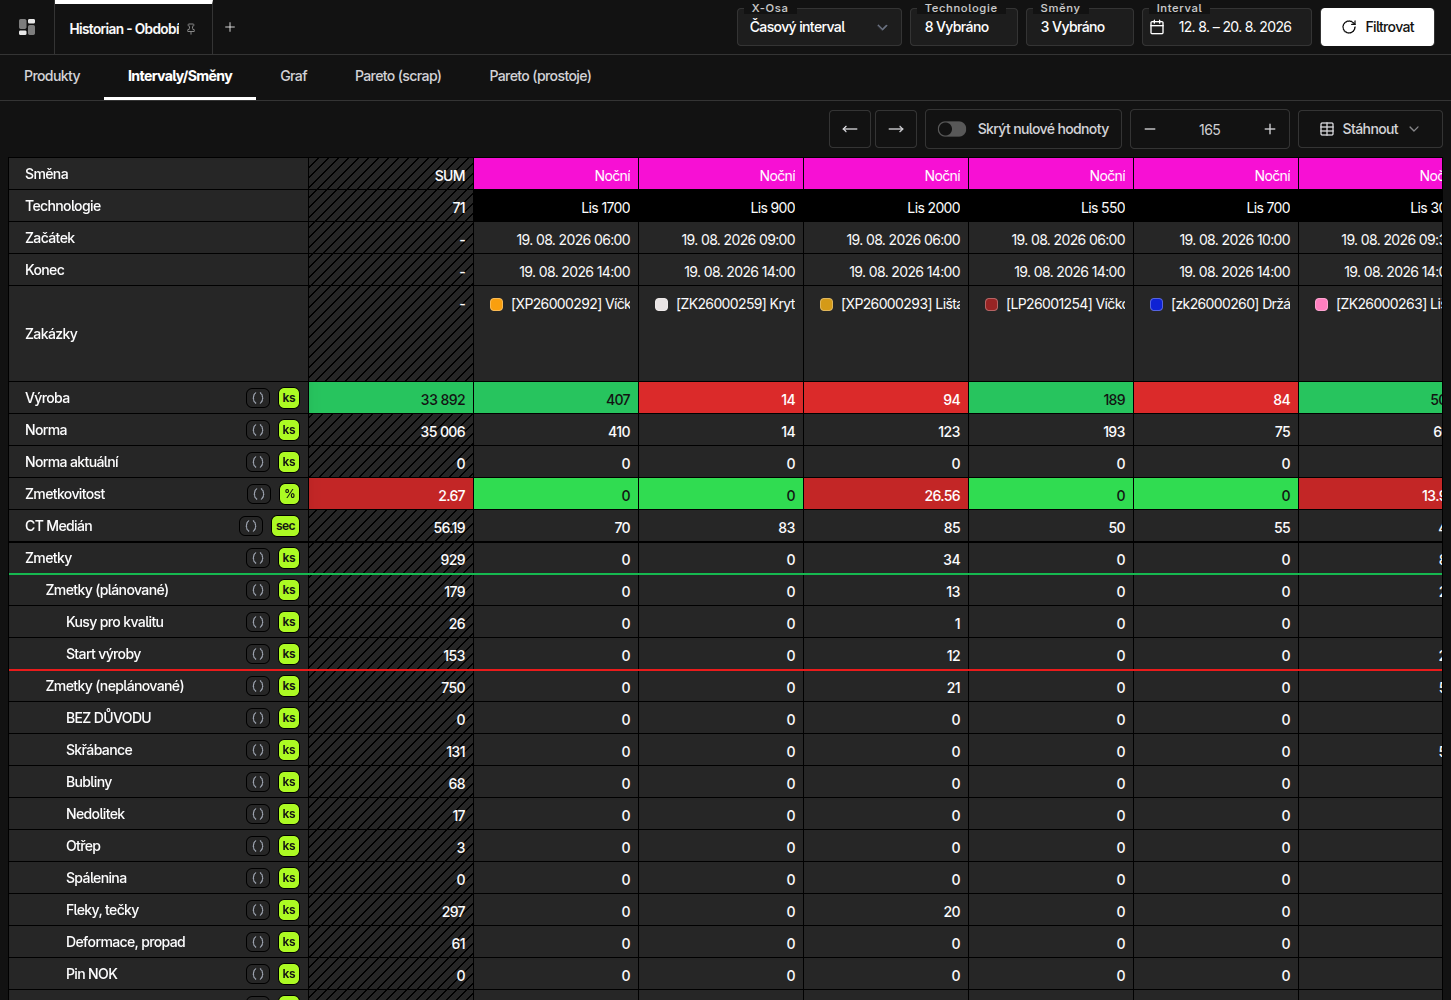
Historian
Production history with configurable metrics — by product, order and period. Individual indicators such as the number of parts produced, downtime duration, efficiency (OEE), availability, performance and quality can be compared across different time periods, shifts, employees, technologies or orders.
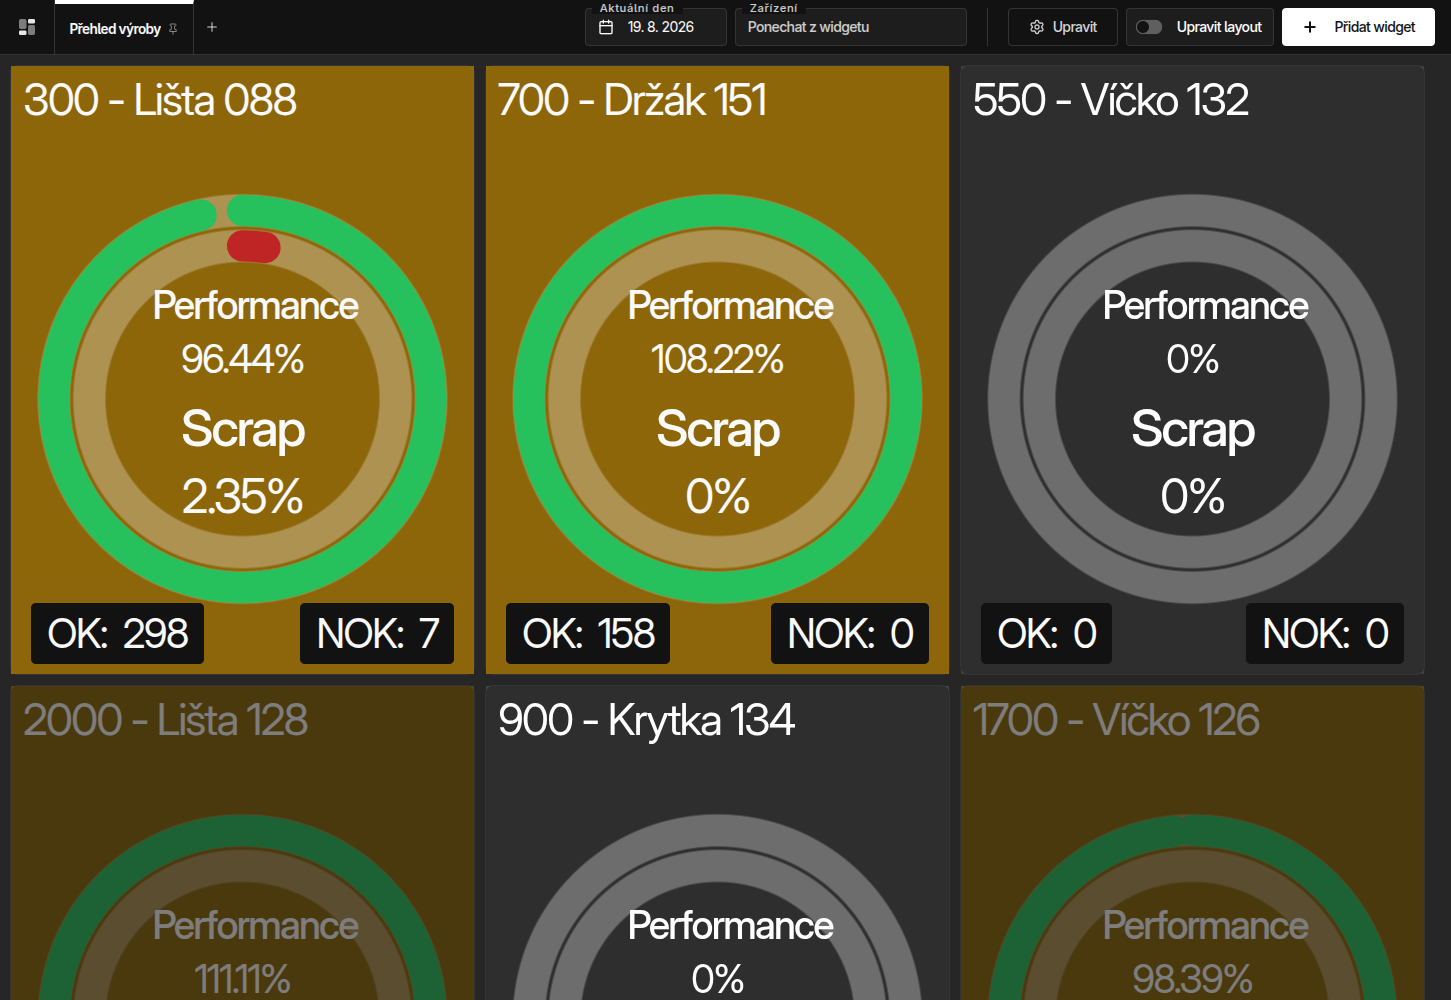
Dashboards
The look of individual dashboards and reports is entirely in your hands. This feature was designed with an emphasis on maximum flexibility and customisability. Each user can design how reports should look and what information they should display. Every dashboard consists of modules that can contain any data, charts or indicators. Simply put them together according to your needs — whether you want to track production performance, the efficiency of individual lines, target fulfilment, scrap or detailed statistics for specific orders.
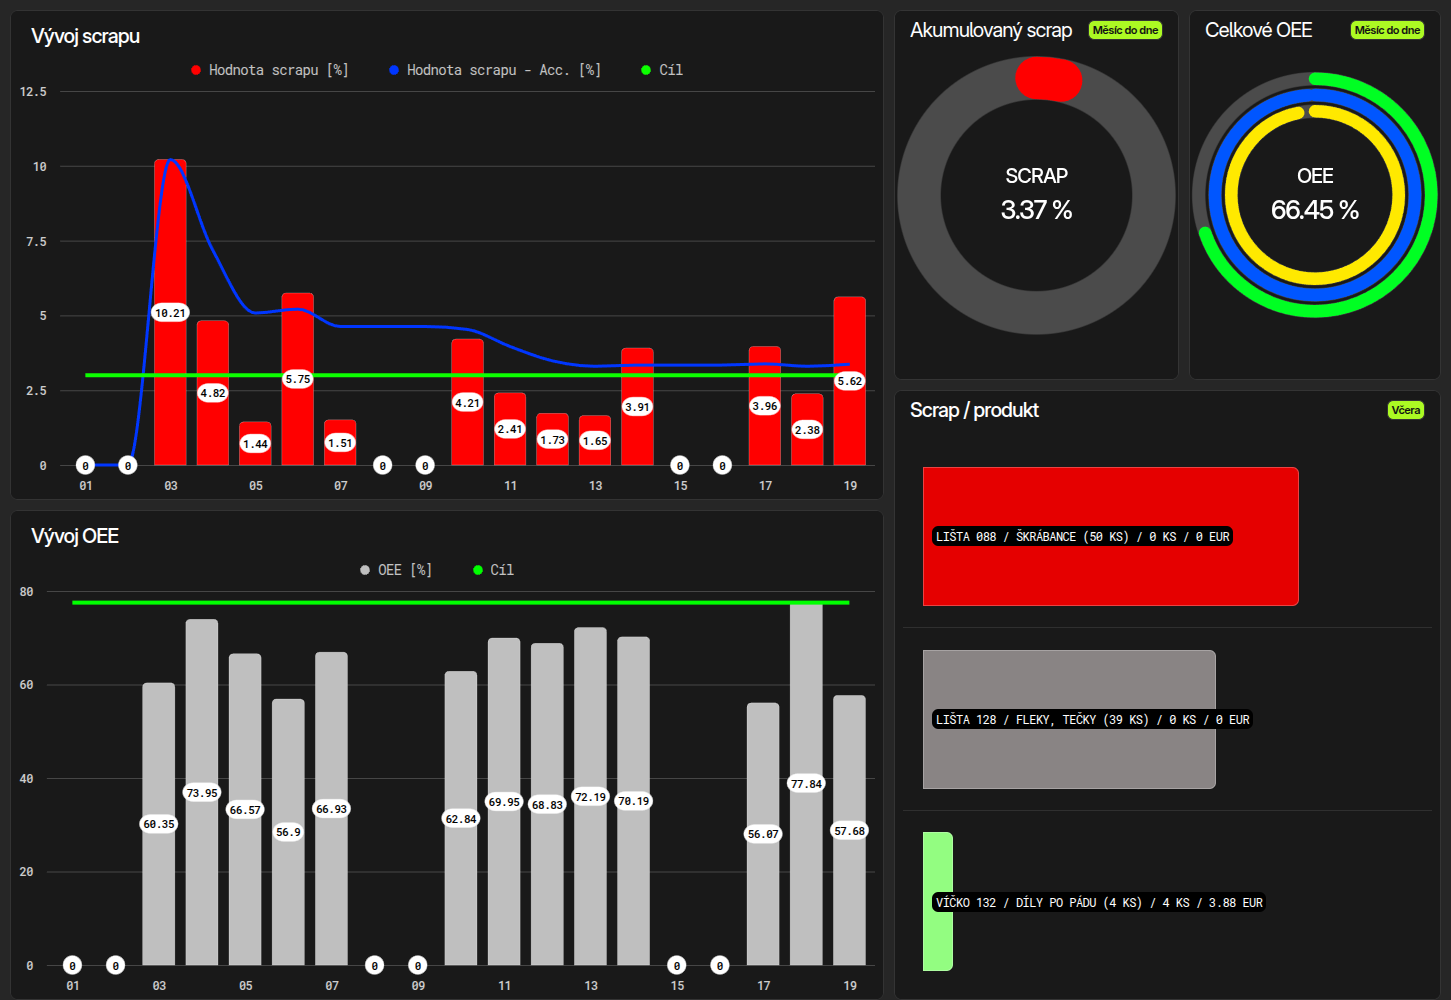
Visualisation
Every dashboard you create can also be used as a visualisation right on the shop floor. A visualisation can consist of several overviews that rotate automatically at regular intervals. This ensures that even operators on production lines have a constant overview of the current status — for example, how much is left to reach the target, what the current efficiency is or where downtimes are occurring. This form of visualisation supports transparency, increases employee engagement and helps keep the team motivated and informed in real time.
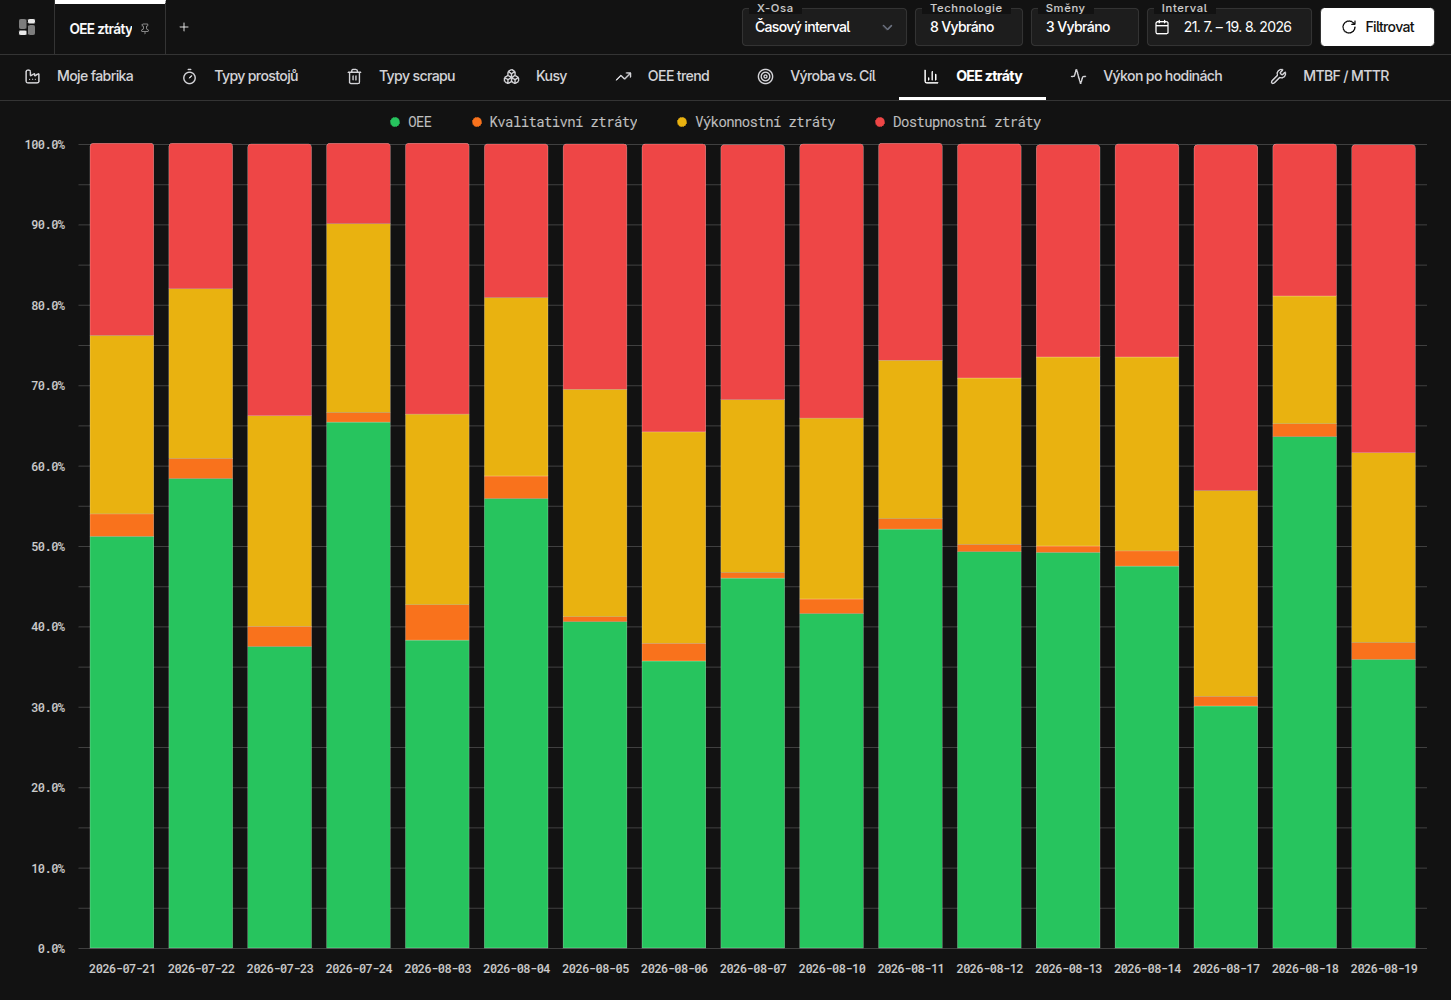
Management charts
Get an instant, comprehensive picture of the state of your entire factory in one click. This module serves as a control centre for managers, production managers and foremen. It consolidates huge amounts of data from lines and machines and turns it into clear, visual dashboards. No more manually exporting data to Excel and wrestling with complex spreadsheets — key trends and metrics are available in real time and in context. Make decisions based on hard data, not impressions. Management charts give you clear arguments for strategic decisions, investments in machines or changes to shift organisation.
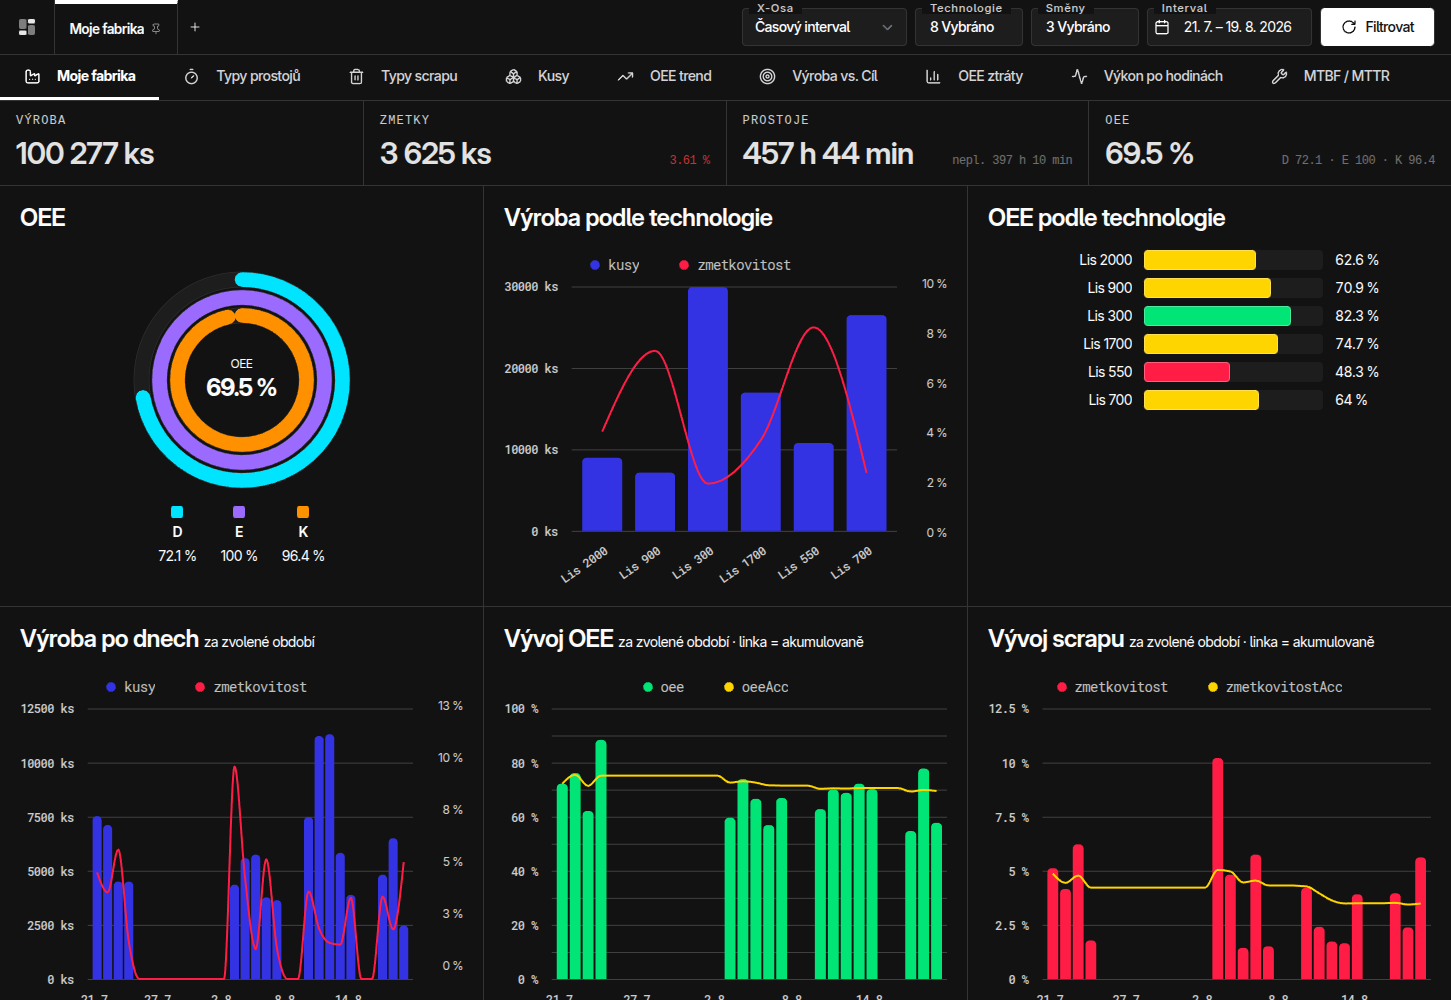
OEE
You can track OEE in detail from different angles, depending on what matters most to you. The system lets you evaluate OEE by individual shifts, specific technologies, time periods, orders or even individual employees. This flexibility enables you to pinpoint the strengths and weaknesses of the production process. You can easily compare the performance of different teams, equipment or shifts, follow efficiency trends over time and focus on the areas with the greatest potential for improvement.
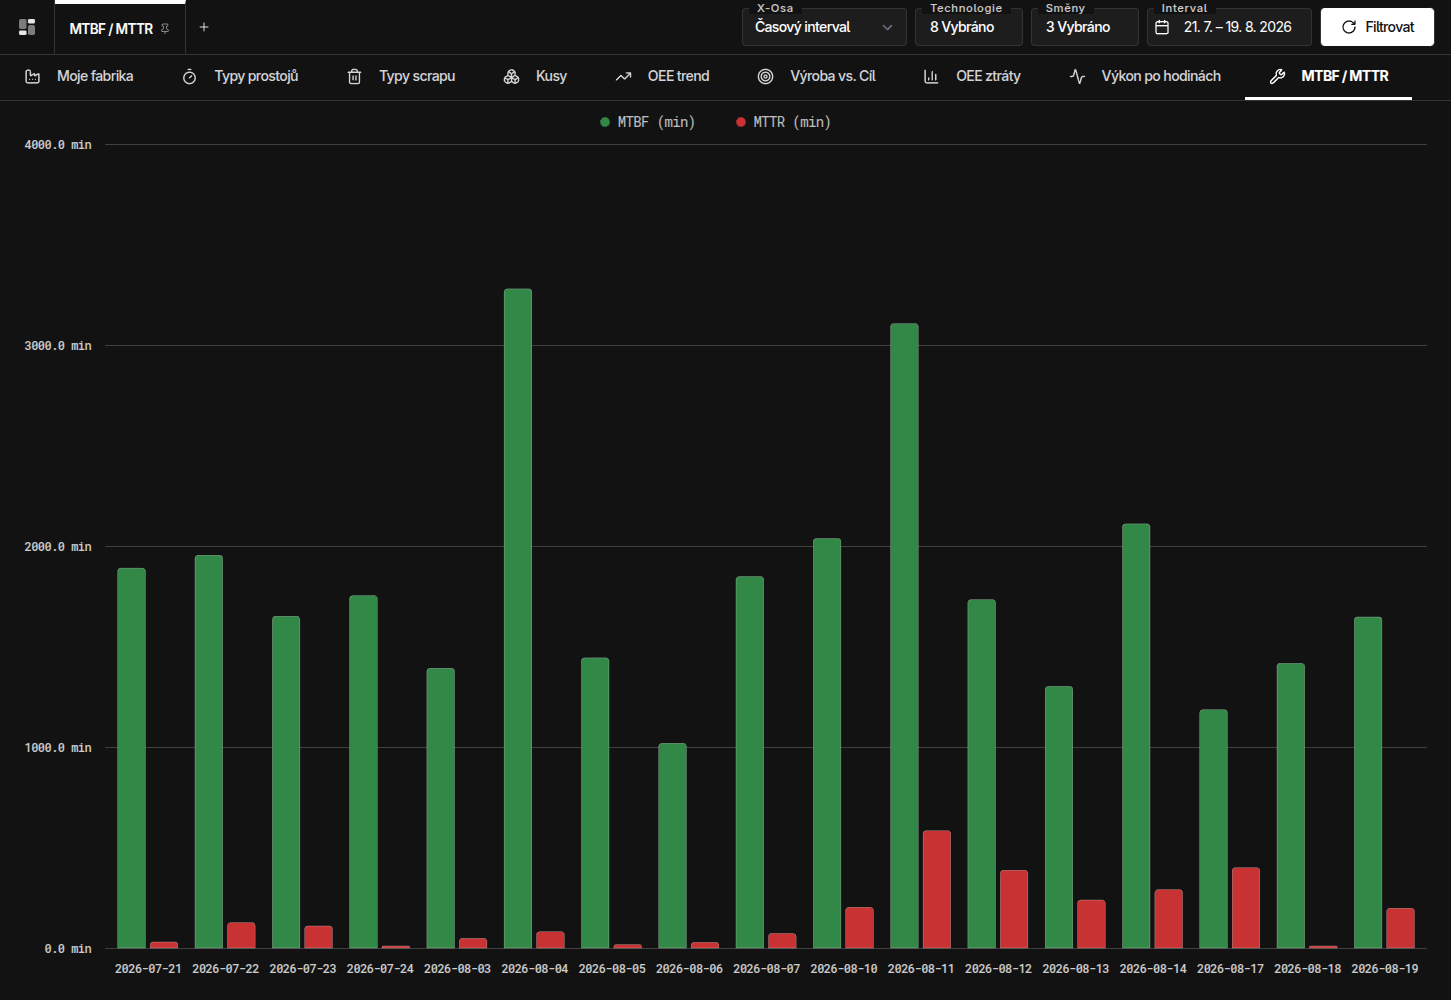
MTBF / MTTR
Monitor machine reliability with the MTBF (mean time between failures) and MTTR (mean time to repair) indicators. The overview helps you quickly evaluate maintenance effectiveness and identify machines with the most frequent breakdowns or lengthy repairs. MTBF is an indicator of pure machine reliability — it tells you how long, on average, a machine runs without a failure. A higher value indicates that your preventive maintenance is working properly and preventing incidents. MTTR is an indicator of responsiveness and readiness — it measures the average time from the occurrence of a failure until the machine is restarted. It helps uncover weak points in work organisation, spare parts availability or information handover.
I will be glad to show you how our solution works and how we can boost the efficiency of your production, too. Book a meeting
+420 608 464 716
jochec@noxem.cz